
Acquisition sources
Collect remote metering data through AMR, telemetry, and API ingestion pathways with a consistent structure for operations teams.
Remote metering and asset visibility
myAMR gives users clear access to remote gas metering data, site status, reports and asset information from one flexible platform.
An online historian for acquiring, storing, and analyzing metering asset data from daily archives to continuous communications.
It can be kept simple for daily meter readings, or expanded into a detailed asset management tool for operators who need more control.
API screenshot.
The platform
myAMR is built around practical operational data. At its simplest, it can show remote meter readings, site status and historical trends in a clean interface.
For larger operators, it can go much further. Custom fields, integrated columns, equations, lookup-style logic and asset management information can be added to support more detailed workflows.
Online historian
myAMR combines remote meter data acquisition, historian storage, and operational analysis in one platform. It supports daily archived readings and continuous communications while linking each data stream to site and asset context.
Collect remote metering data through AMR, telemetry, and API ingestion pathways with a consistent structure for operations teams.
Store daily archives and higher-frequency communications in an online historian model designed for traceability, trend analysis, and repeat reporting.
Compare periods, investigate missing data, and export metering history for billing, engineering review, and audit-friendly reporting workflows.
Connect historian data to inspections, maintenance, references, and custom fields so each reading sits in the right operational context.
Two levels of use (and everything in between)
A clean dashboard can show the important basics: site name, meter data, latest reading, communication status, graphs and simple reports.
The Desktop platform can be populated with integrated fields, custom columns, asset information, inspection dates and operator-specific workflows.
Platform views
Simple users can see clear readings, site status and trends. Advanced operators can work with richer data, calculated columns, asset details and inspection workflows.
You choose the right level of information for each user, without forcing unnecessary complexity onto everyone.
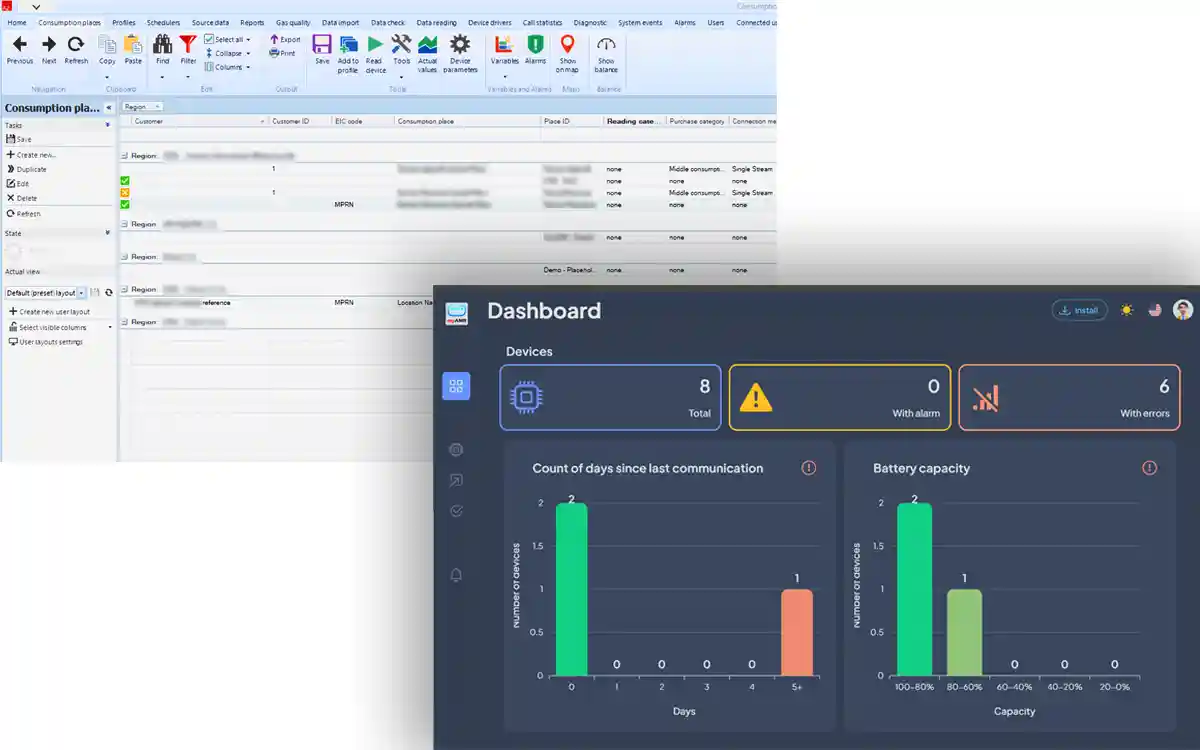
For the simple overview screen showing sites, latest readings and communication status.
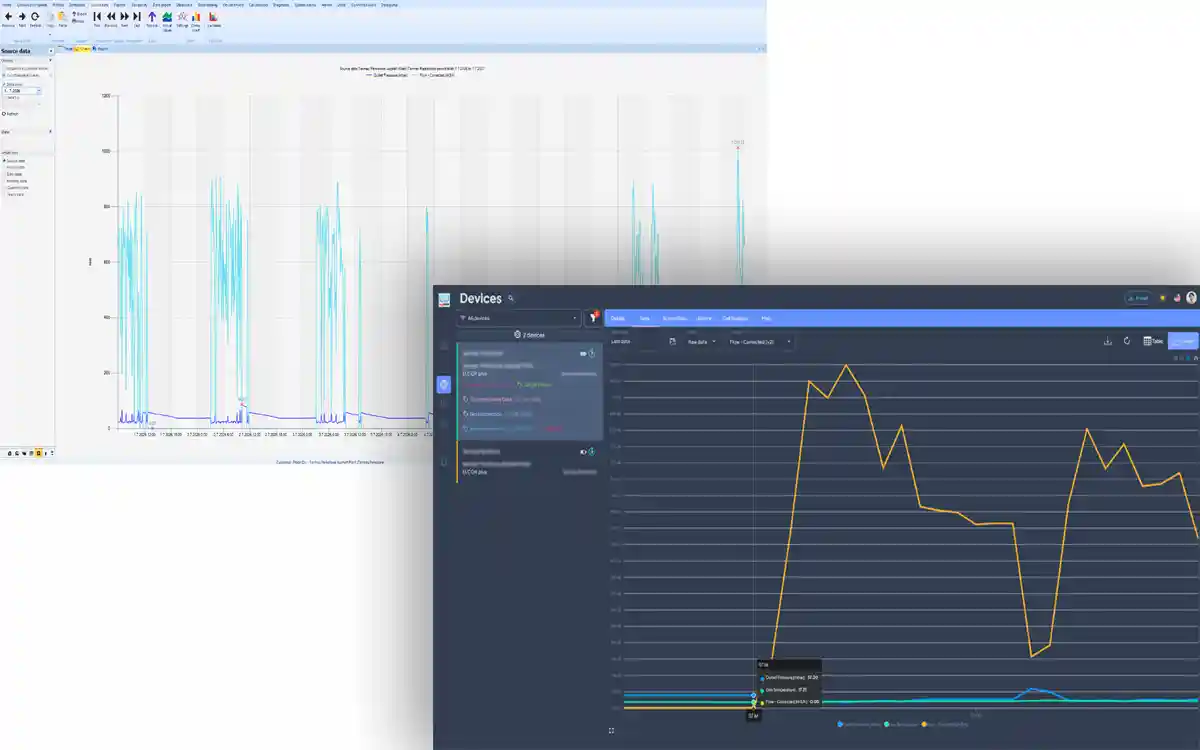
For historical readings, charts, daily data and consumption patterns.
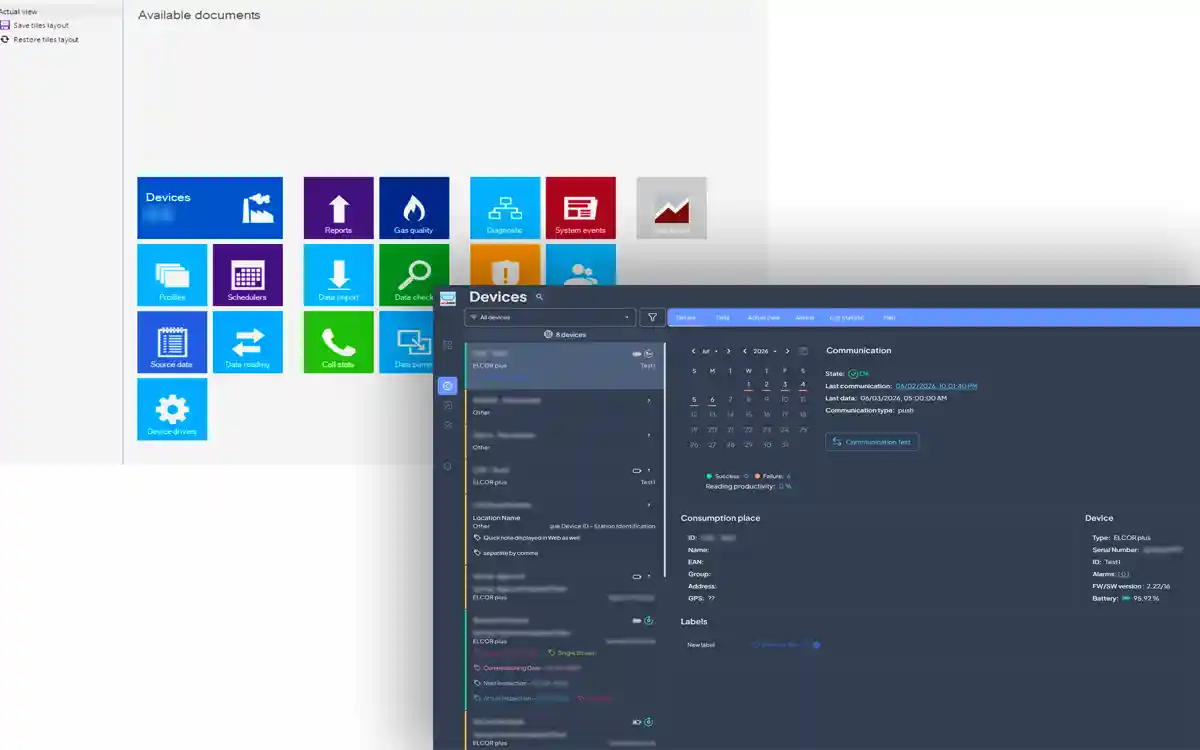
For asset lists, custom columns, inspection dates and operator-level information.
Multiple platforms: Desktop, Web, Mobile, each with the right level of information for each user.
Custom individual views for each user type.
Capabilities
Receive and present metering data from connected field devices and telemetry systems.
Add operator-specific fields for asset references, inspection dates, ownership or site notes.
Use equations and formula-based logic to create useful derived values or trigger decisions from existing data.
Connect related information in a way similar to spreadsheet lookup workflows, but inside the platform.
Support customer reporting, internal review and operational analysis with organised data outputs.
Track useful asset information such as next inspection dates, maintenance schedules, internal notes and operator-level details.
Review historical data, compare periods and identify unusual patterns or missing data.
API-based integration facilitates billing system connectivity and data exchange with other systems and AI applications.
Designed for real use
Many businesses already manage operational information in spreadsheets because spreadsheets are flexible. myAMR keeps that flexibility, but places it inside a structured platform designed for remote metering, connected assets and repeatable reporting.
That means simple users can see only what they need, while advanced users can work with richer data structures, calculated information and asset-level detail.
Why myAMR
myAMR is not limited to one fixed view of data. It can support straightforward remote reading screens, but also more detailed operator workflows where extra fields, calculations and asset information are required.
The aim is to give each user the right level of information without forcing unnecessary complexity onto everyone.
API integration with virtually any billing system or data platform allows myAMR to be part of a wider operational ecosystem, while still keeping the user experience simple and clear.
FAQ
An online historian is a structured way to acquire, store, and query metering asset data over time, from daily archives through to continuous communications.
myAMR supports remote data acquisition workflows using AMR and telemetry pathways, with API integration to connect data from external systems into a consistent operational model.
Yes. API-based integration allows metering historian data to be exchanged with billing systems and related operational platforms.
Yes. myAMR can be configured for simple daily reading views while also supporting deeper historian analysis for advanced operator teams.
Teams use historical metering data to identify missing communications, compare usage periods, support reporting, and tie readings to inspection and maintenance workflows.
Get started
Speak to NC13 Industries about remote gas metering data, connected sites, asset views, integrations and reporting workflows.